1. Review of Linear Graphs (y = mx + c)
- General Strategy: To plot a linear graph, determine two key points on the axes:
- y-intercept: Set x = 0 \implies y = c. The graph passes through (0, c).
- x-intercept: Set y = 0 \implies mx + c = 0 \implies x = -\frac{c}{m}. The graph passes through \left(-\frac{c}{m}, 0\right).
- Why two points work: Because y = mx + c is a straight line, finding two points is sufficient to draw the complete line.
2. Understanding Functions (y = f(x))
- Intuitive Meaning: y changes simultaneously as x changes (y depends on x).
- Mathematical Meaning: y can be expressed as an algebraic combination/expression involving x.
- Universal Plotting Strategy for any Curve y = f(x):
- Find the y-intercept: Substitute x = 0 into y = f(x) to evaluate f(0).
- Find the x-intercept(s): Set y = 0 and solve the equation f(x) = 0.
- Determine Curve Geometry: Identify additional points, symmetry, or vertices to complete the sketch.
3. Example: Plotting a Non-Linear Curve (y^2 = 4 - x^2)
- y-intercepts: Set x = 0 \implies y^2 = 4 \implies y = \pm 2. Points: (0, 2) and (0, -2).
- x-intercepts: Set y = 0 \implies 0 = 4 - x^2 \implies x^2 = 4 \implies x = \pm 2. Points: (2, 0) and (-2, 0).
- Shape: The given equation is the equation of a circle. Connecting these four points smoothly forms a circle centered at the origin with radius r = 2 (x^2 + y^2 = 2^2).
4. Basic Parabolas (y = ax^2)
- Standard Form (y = x^2 or y = ax^2):
- Setting x = 0 \implies y = 0 and setting y = 0 \implies x = 0. The x- and y-intercepts meet at the origin (0,0).
- The curve is an upward-turned parabola symmetrical around the y-axis.
- Fixing the scale: Substitute one additional x-value (e.g., x = 2 \implies y = 4a) to fix the curve, then draw symmetrically.
- Negative Coefficient (y = -2x^2):
- Forms a downward-turned parabola passing through (0,0) (e.g., at x = 2, y = -8).
6. General Quadratic Curves y = ax^2 + bx + c
- y-intercept: Set x = 0 \implies y = c \implies \mathbf{(0, c)}.
- x-intercepts: Solve ax^2 + bx + c = 0 using factorization or quadratic methods.
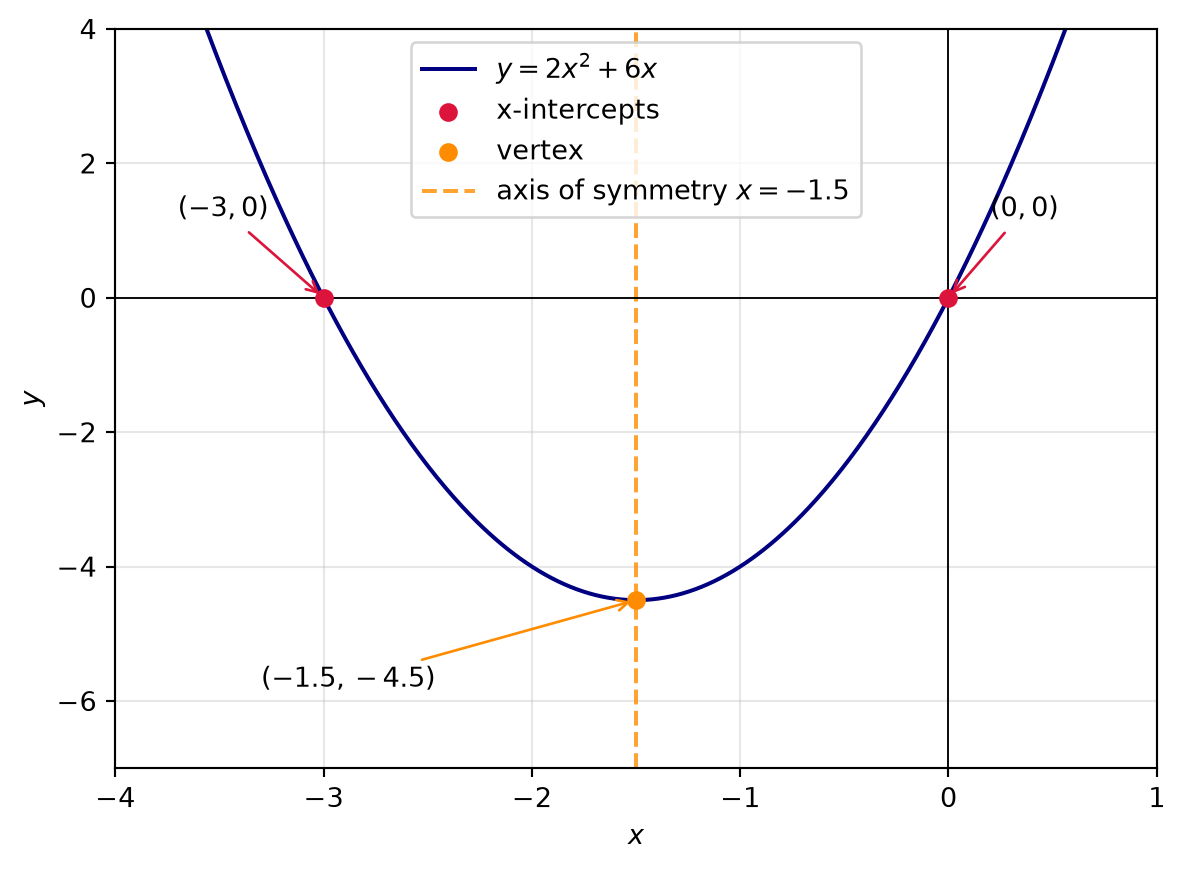
- Symmetry Shortcut: y = c occurs at both x = 0 and x = -\frac{b}{a}. The midpoint between them gives the axis of symmetry x = -\frac{b}{2a}.
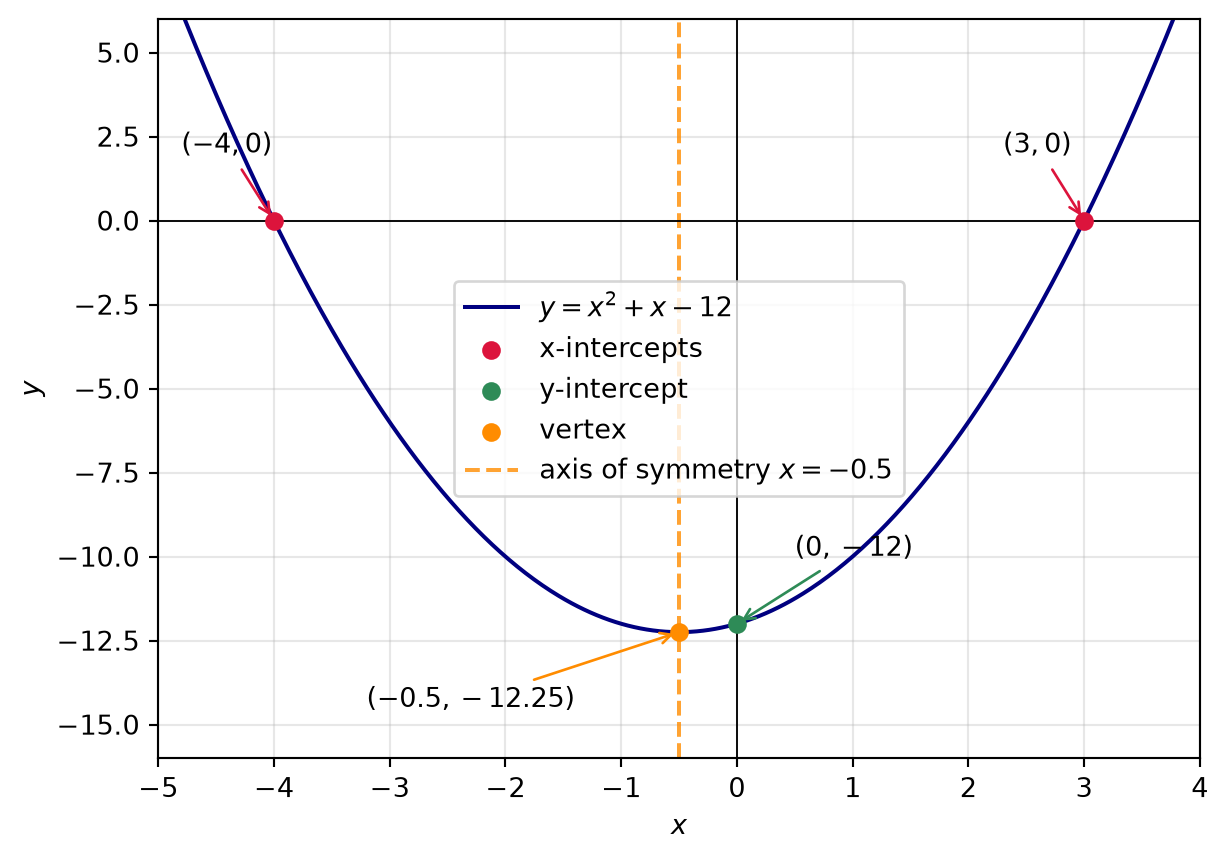
Factorizable Example: y = x^2 + x - 12 = (x - 3)(x + 4)
- y-intercept: Set x = 0 \implies y = (0-3)(0+4) = -12 \implies \mathbf{(0, -12)}.
- x-intercepts: Set y = 0 \implies (x - 3)(x + 4) = 0 \implies x = 3 \text{ or } x = -4 \implies \mathbf{(3, 0) \text{ and } (-4, 0)}.
- Vertex x-value: x_v = \frac{3 + (-4)}{2} = \mathbf{-0.5}.
- Vertex y-value: y_v = (-0.5 - 3)(-0.5 + 4) = (-3.5)(3.5) = \mathbf{-12.25}.
- Vertex Coordinates: (-0.5, -12.25).
7. Homework & Pre-Work Assignment
- Task 1: Find x- and y-intercepts for various given functions y = f(x).
- Task 2: Sketch curves of the form y = ax^2 + bx.
- Task 3: Sketch factorizable quadratic curves y = ax^2 + bx + c.
- Mandatory Formatting: Write mathematical steps on the left side of the page and the step-by-step narrative reasoning on the right side.
- Class Preparation: Practice explaining each step out loud to a classmate prior to the next session.