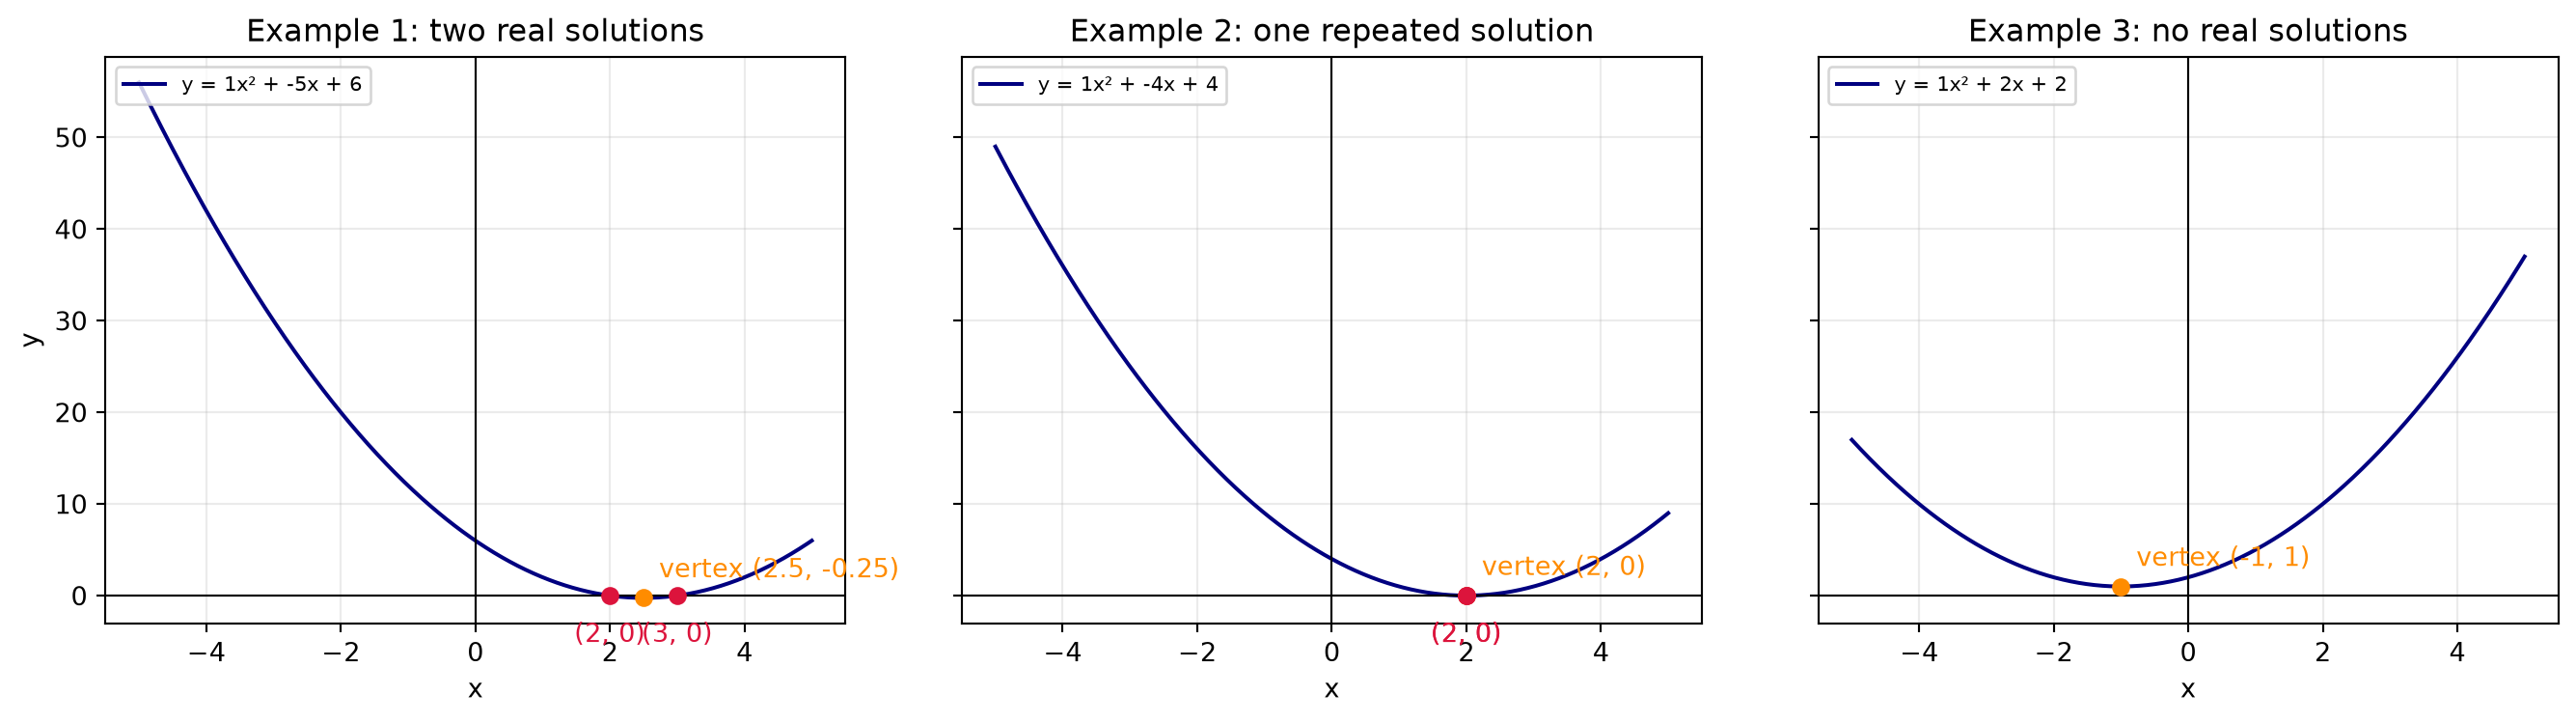
import numpy as np
import matplotlib.pyplot as plt

x = np.linspace(-5, 5, 600)
examples = [
    (1, -5, 6, "Example 1: two real solutions"),
    (1, -4, 4, "Example 2: one repeated solution"),
    (1, 2, 2, "Example 3: no real solutions"),
]

fig, axes = plt.subplots(1, 3, figsize=(14, 4), sharey=True)
for ax, (a, b, c, title) in zip(axes, examples):
    y = a*x**2 + b*x + c
    delta = b**2 - 4*a*c
    vertex_x = -b / (2*a)
    vertex_y = a*vertex_x**2 + b*vertex_x + c

    ax.plot(x, y, color="navy", label=f"y = {a}x² + {b}x + {c}")
    ax.axhline(0, color="black", linewidth=0.8)
    ax.axvline(0, color="black", linewidth=0.8)
    ax.scatter(vertex_x, vertex_y, color="darkorange", zorder=3)
    ax.annotate(
        f"vertex ({vertex_x:g}, {vertex_y:g})",
        (vertex_x, vertex_y),
        xytext=(6, 8),
        textcoords="offset points",
        color="darkorange",
    )

    if delta >= 0:
        roots = np.roots([a, b, c])
        real_roots = sorted(r.real for r in roots if abs(r.imag) < 1e-9)
        ax.scatter(real_roots, [0] * len(real_roots), color="crimson", zorder=3)
        for root in real_roots:
            ax.annotate(
                f"({root:g}, 0)",
                (root, 0),
                xytext=(0, -18),
                textcoords="offset points",
                ha="center",
                color="crimson",
            )

    ax.set_title(title)
    ax.set_xlabel("x")
    ax.grid(alpha=0.25)
    ax.legend(fontsize=8, loc="upper left")

axes[0].set_ylabel("y")
plt.tight_layout()
plt.show()