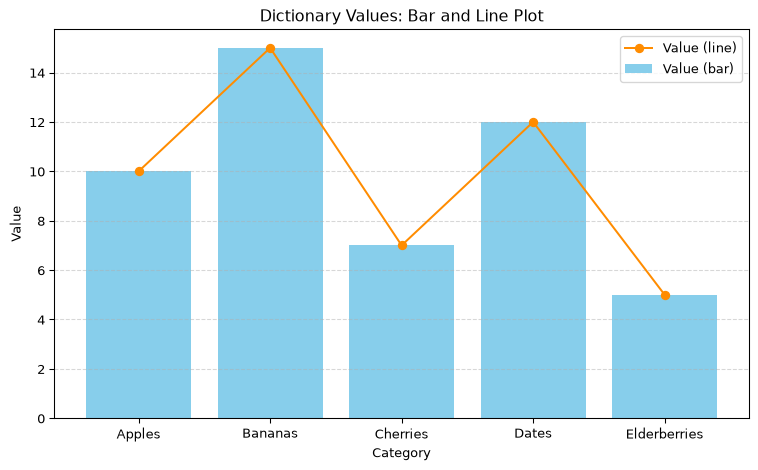
We revised the math behind the prime number problem and the pseudocode for the program. We also discussed how to plot the results of a simulation using matplotlib. Specifically, we looked at how to plot a bar graph, a line graph, both on the same graph, and how to draw subplots.
Here is an example program that uses a dictionary to plot a line and bars on the same graph.
import matplotlib.pyplot as plt# Create a simple dictionary with categories and valuesdata = {"Apples": 10,"Bananas": 15,"Cherries": 7,"Dates": 12,"Elderberries": 5,}# Extract keys and values for plottingcategories =list(data.keys())values =list(data.values())# Create the bar chartplt.figure(figsize=(8, 5))plt.bar(categories, values, color='skyblue', label='Value (bar)')# Add a line plot for the same dataplt.plot(categories, values, color='darkorange', marker='o', linestyle='-', label='Value (line)')# Add labels and titleplt.xlabel('Category')plt.ylabel('Value')plt.title('Dictionary Values: Bar and Line Plot')plt.legend()plt.grid(axis='y', linestyle='--', alpha=0.5)# Show the plotplt.tight_layout()plt.show()
Homework for the next session is to generate a program for rock paper scissors.