import numpy as np                      # Import NumPy for numerical calculations
import matplotlib.pyplot as plt         # Import Matplotlib for plotting graphs

x_values = np.linspace(-1.5, 6, 400)                     # Create 400 x-values from -1.5 to 6 for plotting
fig, ax = plt.subplots(figsize=(7, 5))                   # Create a figure 7 inches wide and 5 inches tall, change and check

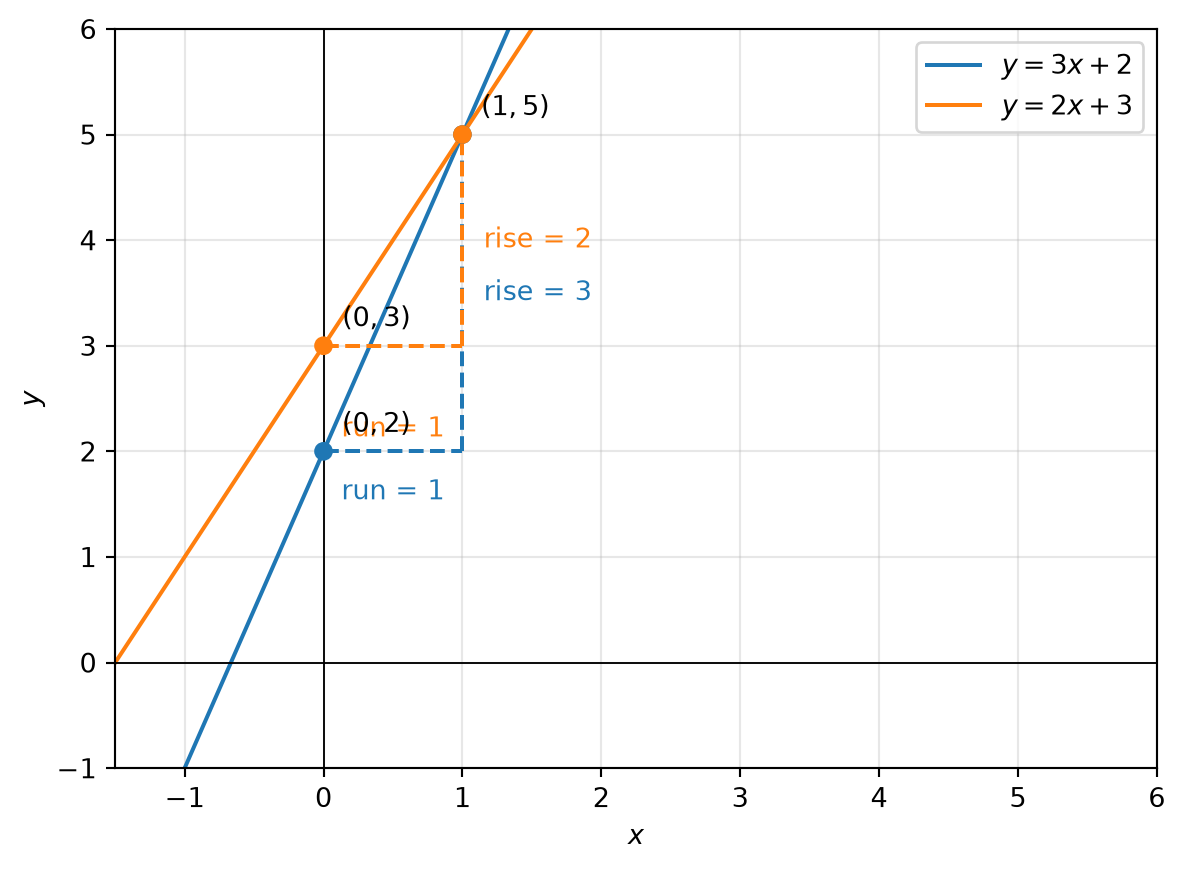
ax.plot(x_values, 3*x_values + 2, label=r'$y=3x+2$', color='tab:blue')
# Plot the line y = 3x + 2; label gives the legend text, color makes it blue
ax.plot(x_values, 2*x_values + 3, label=r'$y=2x+3$', color='tab:orange')
# Plot the line y = 2x + 3; label sets the legend name, color makes it orange

# Rise and run for y=3x+2: (0, 2) to (1, 5).
ax.plot([0, 1], [2, 2], '--', color='tab:blue', lw=1.5)
# Draw a dashed horizontal run from x=0 to x=1 at y=2; '--' makes it dashed, color uses blue, lw sets line width
ax.plot([1, 1], [2, 5], '--', color='tab:blue', lw=1.5)
# Draw a dashed vertical rise from (1,2) to (1,5); color is blue, lw sets the line width
ax.annotate('run = 1', (0.5, 2), xytext=(0, -18), textcoords='offset points', ha='center', color='tab:blue')
# Put the text 'run = 1' at (0.5,2); xytext shifts the label by 0 points horizontally and -18 points vertically; offset points means the shift is measured in points; ha centers the text; color makes it blue
ax.annotate('rise = 3', (1, 3.5), xytext=(8, 0), textcoords='offset points', va='center', color='tab:blue')
# Put the text 'rise = 3' at (1,3.5); xytext shifts it by 8 points right and 0 points vertically; textcoords uses points for the shift; va centers the text vertically; color makes it blue

# Rise and run for y=2x+3: (0, 3) to (1, 5).
ax.plot([0, 1], [3, 3], '--', color='tab:orange', lw=1.5)
# Draw the dashed horizontal run from x=0 to x=1 at y=3; color uses orange and lw sets the line width
ax.plot([1, 1], [3, 5], '--', color='tab:orange', lw=1.5)
# Draw the dashed vertical rise from (1,3) to (1,5); color is orange, lw sets the line width
ax.annotate('run = 1', (0.5, 3), xytext=(0, -34), textcoords='offset points', ha='center', color='tab:orange')
# Put the text 'run = 1' at (0.5,3); xytext shifts it by 0 points horizontally and -34 points vertically; offset points uses points for the shift; ha centers the label; color makes it orange
ax.annotate('rise = 2', (1, 4), xytext=(8, 0), textcoords='offset points', va='center', color='tab:orange')
# Put the text 'rise = 2' at (1,4); xytext shifts it by 8 points to the right; textcoords uses point offsets; va centers vertically; color makes it orange

ax.scatter([0, 1, 0, 1], [2, 5, 3, 5], color=['tab:blue', 'tab:blue', 'tab:orange', 'tab:orange'], zorder=3)
# Plot four points at (0,2), (1,5), (0,3), (1,5); the x and y lists give the coordinates; color gives each point a color in order; zorder=3 draws them on top of the lines
ax.annotate(r'$(0,2)$', (0, 2), xytext=(7, 7), textcoords='offset points')
# Label the point (0,2) with text $(0,2)$; xytext shifts the label right by 7 points and up by 7 points; textcoords uses point offsets
ax.annotate(r'$(1,5)$', (1, 5), xytext=(7, 7), textcoords='offset points')
# Label the point (1,5), the point of intersection, with text $(1,5)$; xytext moves the label 7 points right and 7 points up
ax.annotate(r'$(0,3)$', (0, 3), xytext=(7, 7), textcoords='offset points')
# Label the point (0,3) with text $(0,3)$; xytext moves the label 7 points right and 7 points up

ax.axhline(0, color='black', lw=.7)  # Draw the horizontal x-axis at y=0; color makes it black and lw sets the line thickness
ax.axvline(0, color='black', lw=.7)  # Draw the vertical y-axis at x=0; color makes it black and lw sets the line thickness
ax.set(xlim=(-1.5, 6), ylim=(-1, 6), xlabel=r'$x$', ylabel=r'$y$')
# Set the x and y limits of the graph; xlabel and ylabel give the names for the axes
ax.grid(True, alpha=.3)  # Add a light grid with transparency 0.3 to make the graph easier to read
ax.legend()  # Show the legend for the two plotted lines
plt.show()  # Display the final graph on screen