Demand and Supply Curves
Learning objectives
By the end of this chapter, you should be able to:
- explain what economists mean by a market and the price mechanism;
- define effective demand and supply;
- distinguish between individual and market demand or supply;
- explain the determinants of demand and supply;
- interpret demand and supply schedules and curves;
- distinguish a movement along a curve from a shift of the curve;
- explain how changes in non-price determinants shift demand or supply.
NoteThe central idea
Demand describes the buying side of a market. Supply describes the selling side. Price changes normally cause movements along a curve; changes in other determinants cause the whole curve to shift.
1. Markets and the price mechanism
A market is any arrangement through which buyers and sellers exchange goods, services or other tradable items. A market does not need to be a physical place. Examples include:
- the local food market;
- the housing and labour markets;
- the market for smartphones or computers;
- global markets for coffee, cotton and oil;
- stock, foreign-exchange and online markets.
The price mechanism helps allocate scarce resources. Prices communicate information:
- a shortage tends to push price upwards and signals producers to allocate more resources to the product;
- an oversupply tends to push price downwards and signals producers to allocate fewer resources to the product.
When it works effectively, the price mechanism coordinates decisions without direct government instruction.
2. Demand
Definition
Demand is the quantity of a product that buyers are willing and able to buy at different prices per period of time, ceteris paribus (other things remaining equal).
Each part of this definition matters:
- Quantity: a numerical amount.
- Product: a good, service, currency or financial asset being traded.
- Willing to buy: the buyer wants the product. This is called notional demand.
- Able to buy: the buyer has sufficient purchasing power. Notional demand backed by purchasing power becomes effective demand.
- Different prices: demand is examined at various possible prices.
- Per period of time: the time period must be stated, such as 500 units per week.
- Ceteris paribus: other influences are held constant so that the relationship can be analysed clearly.
TipRemember
Wanting a product is not enough to create effective demand. A buyer must also be able to pay for it.
Individual and market demand
An individual demand curve shows the quantity one consumer is willing and able to buy at different prices. A market demand curve is the horizontal sum or aggregation of the demand curves of all consumers in the market.
The law of demand
Assuming other factors remain unchanged, price and quantity demanded have an inverse relationship:
- when price rises, quantity demanded falls;
- when price falls, quantity demanded rises.
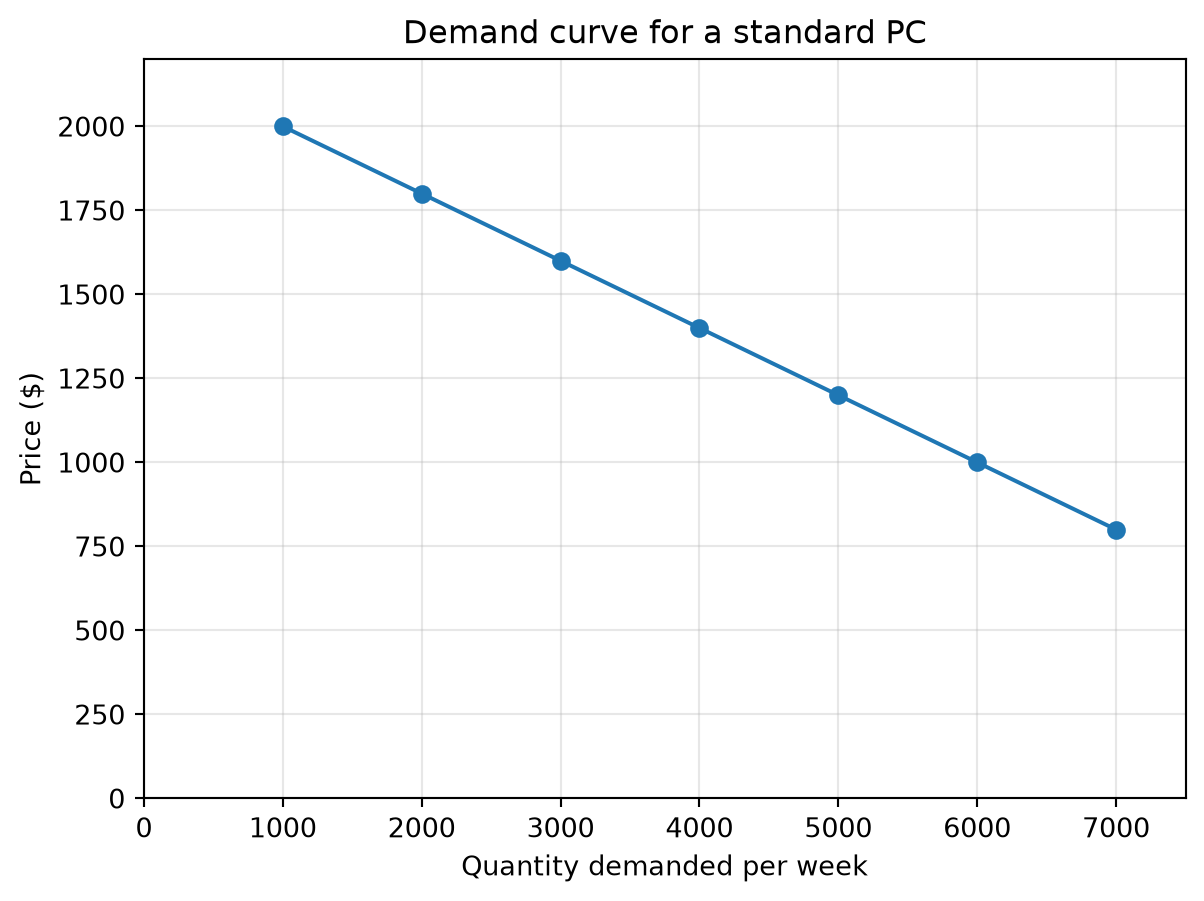
A demand curve is usually drawn downward sloping from left to right.
Demand schedule and curve
A demand schedule is a table showing quantities demanded at different prices. Plotting these combinations gives a demand curve.
For example:
| Price of a standard PC ($) | Quantity demanded per week |
|---|---|
| 2,000 | 1,000 |
| 1,800 | 2,000 |
| 1,600 | 3,000 |
| 1,400 | 4,000 |
| 1,200 | 5,000 |
| 1,000 | 6,000 |
| 800 | 7,000 |
A demand curve shows a relationship that is usually:
- inverse or negative;
- continuous;
- time-based;
- subject to the ceteris paribus assumption.
Quantity demanded versus demand
These terms must not be confused:
- Quantity demanded means a particular amount bought at a particular price.
- Demand means the entire relationship or demand schedule.
A change in the product’s own price causes a change in quantity demanded, shown by movement along the existing demand curve. It does not, by itself, shift the demand curve.
Consumer expenditure and firm revenue
Total consumer expenditure, which is also the firm’s total revenue for the product, is:
\[ \text{Total expenditure} = \text{price} \times \text{quantity bought} \]
For example, if 2,000 PCs are bought at $1,800 each:
\[ 2,000 \times 1,800 = \$3,600,000 \]
3. Determinants of demand
The product’s own price is not the only influence on demand. Important non-price determinants include income, related products, and fashion, taste and attitudes.
Income
For most normal goods, income and demand have a positive relationship. When income rises, demand increases; when income falls, demand decreases. Examples include cars, housing, restaurant meals and quality clothing.
For an inferior good, income and demand have a negative relationship. As income rises, consumers buy less of the inferior good and switch towards preferred alternatives. Examples may include low-quality food or used clothing, although classification depends on the consumer and context.
Fashion, taste and attitudes
Consumer preferences can be influenced by fashion, advertising, reviews, culture, social attitudes and personal experience. A favourable change increases demand; an unfavourable change decreases demand.
4. Supply
Definition
Supply is the quantity of a product that suppliers are willing and able to sell at different prices over a period of time, ceteris paribus.
Supply refers to the selling side of the market. Suppliers may be manufacturers, retailers, service providers or other participants in a supply chain.
Individual and market supply
An individual supply curve shows how much one firm plans to sell at different prices. A market supply curve is the sum of the supply curves of all firms in the market.
The law of supply
Assuming other factors remain unchanged, price and quantity supplied have a positive or direct relationship:
- when price rises, quantity supplied generally rises;
- when price falls, quantity supplied generally falls.
A supply curve is usually upward sloping from left to right because a higher price can make production more profitable.
Supply schedule and curve
| Price of a standard PC ($) | Quantity supplied per week |
|---|---|
| 800 | 1,000 |
| 1,000 | 2,000 |
| 1,200 | 3,000 |
| 1,400 | 4,000 |
| 1,600 | 5,000 |
| 1,800 | 6,000 |
| 2,000 | 7,000 |
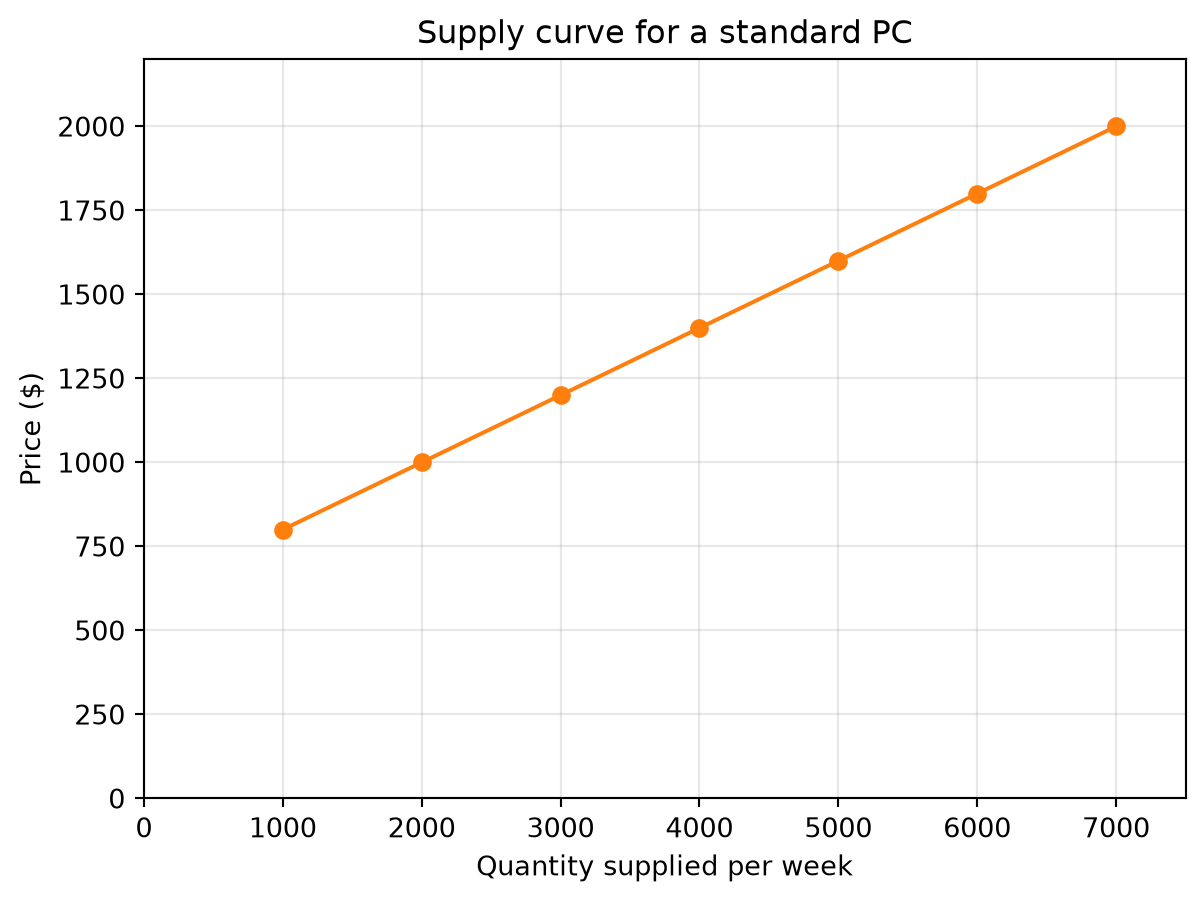
A supply curve shows a relationship that is usually:
- positive or direct;
- continuous;
- time-based;
- subject to the ceteris paribus assumption.
A change in the product’s own price causes a movement along the existing supply curve and changes quantity supplied. It does not, by itself, shift the supply curve.
5. Determinants of supply
Costs of production
Supply decisions are strongly influenced by production and distribution costs. Important costs may include:
- wages and other labour costs;
- energy and raw materials;
- transport and storage;
- machinery and technology;
- worker productivity.
A fall in costs usually increases supply. A rise in costs usually decreases supply.
Size and nature of the industry
Growth in an industry may attract new firms and increase market supply. Increased competition may reduce prices. If firms leave the industry, market supply may fall.
Prices of other products
Firms compare the profitability of different products. If a competitor raises its price, another firm may supply more of its own product. If a competitor lowers its price, the firm may reduce its supply, especially if its own costs remain unchanged.
Government policy
- An indirect tax raises firms’ costs and usually decreases supply.
- A subsidy lowers effective costs and usually increases supply.
- Regulations may increase costs and reduce supply, depending on their design.
Other factors
Weather, natural conditions, disruptions, technology and unexpected events can affect supply. These influences are especially important in agriculture, where drought, frost or storms may reduce output.
6. Shifts in demand
The demand curve is drawn assuming that non-price determinants remain constant. When a non-price determinant changes, the entire demand curve shifts.
- A shift to the right means an increase in demand.
- A shift to the left means a decrease in demand.
| Demand increases: curve shifts right | Demand decreases: curve shifts left |
|---|---|
| Income increases for a normal good | Income decreases for a normal good |
| Price of a substitute increases | Price of a substitute decreases |
| Price of a complement decreases | Price of a complement increases |
| Favourable change in fashion, taste or attitudes | Unfavourable change in fashion, taste or attitudes |
WarningExam language
Say “demand increases” or “the demand curve shifts right” when a non-price determinant changes. Say “quantity demanded increases” or “there is an extension along the demand curve” when the product’s own price falls.
7. Shifts in supply
When a non-price determinant of supply changes, the entire supply curve shifts.
- A shift to the right means an increase in supply.
- A shift to the left means a decrease in supply.
| Supply increases: curve shifts right | Supply decreases: curve shifts left |
|---|---|
| Costs of production decrease | Costs of production increase |
| The industry grows | The industry declines |
| Price of a competing product decreases | Price of a competing product increases |
| Indirect tax decreases | Indirect tax increases |
| Subsidy increases | Subsidy decreases |
| Technology or productivity improves | Disruption, poor weather or lower productivity |
Effect of change in the price of a competing product on supply
Think of a firm as trying to make as much profit as possible. Profit depends on two things: how much it can sell each unit for (price) and how much it costs to make each extra unit.
- When a competitor raises its price, their product becomes less attractive to buyers.
- More customers are willing to buy your product instead, even at your current price.
- So you can sell more and make more total profit.
- You respond by producing and supplying more of your product.
- More customers are willing to buy your product instead, even at your current price.
- When a competitor lowers its price, their product becomes more attractive.
- Some of your customers switch to them, or you must accept selling less at your price.
- Each unit you make is now less profitable in practice, even if your costs haven’t changed.
- So you respond by producing and supplying less.
- Some of your customers switch to them, or you must accept selling less at your price.
In short: firms watch how profitable each product looks compared to others. If a rival’s price move makes your product look more profitable, you supply more; if it makes your product look less profitable, you supply less - even if your own costs stay the same.
8. Movement along a curve or shift?
Use this decision rule:
- Ask whether the product’s own price has changed.
- If only the product’s own price changes, show a movement along the curve.
- If any non-price determinant changes, shift the entire curve.
- Identify whether the change is an increase or decrease.
| Situation | What changes? | Diagram effect |
|---|---|---|
| Price of the product falls | Quantity demanded rises | Extension along demand curve |
| Price of the product rises | Quantity demanded falls | Contraction along demand curve |
| Price of the product falls | Quantity supplied falls | Contraction along supply curve |
| Price of the product rises | Quantity supplied rises | Extension along supply curve |
| Income rises for a normal good | Demand rises | Demand curve shifts right |
| Production costs rise | Supply falls | Supply curve shifts left |
Worked examples
Example 1: Price change
The price of a smartphone falls. Other factors remain unchanged. Consumers buy more smartphones. This is an extension of demand, or an increase in quantity demanded, shown by movement down the existing demand curve.
Example 2: Substitute price change
The price of iced tea rises. Cola becomes relatively more attractive, so demand for cola increases. The demand curve for cola shifts right.
Example 3: Production cost change
Wages paid by smartphone producers rise. Production becomes more expensive, so firms supply less at every possible price. The supply curve shifts left.
9. Applying the model: coffee production
Suppose coffee producers adopt harvesting machines that reduce harvesting costs. Lower costs increase supply, so the supply curve shifts right. If global demand for coffee is also increasing but supply increases by even more because of mechanisation, the market price may still fall.
The example also raises wider questions:
- Does the technology reduce employment for agricultural workers?
- Who receives the benefits of lower costs?
- Can small producers afford the machinery?
- Are environmental and social effects included in the market price?
Economic analysis should therefore be combined with ethical and social analysis when evaluating real-world policies and technologies.
Key terms for quick recall
| Term | Definition |
|---|---|
| Market | An arrangement through which buyers and sellers exchange products. |
| Price mechanism | The way prices communicate information and allocate resources between competing uses. |
| Demand | The quantity buyers are willing and able to buy at different prices per period of time, other things equal. |
| Notional demand | The desire or willingness to buy a product without necessarily having the purchasing power to do so. |
| Effective demand | Demand supported by both willingness to buy and the ability to pay. |
| Quantity demanded | The amount consumers buy at a particular price. |
| Demand schedule | A table showing quantities demanded at different prices. |
| Demand curve | A graph showing the relationship between price and quantity demanded. |
| Market demand | The total demand of all consumers in a market. |
| Normal good | A good whose demand rises when income rises and falls when income falls. |
| Inferior good | A good whose demand falls when income rises, as consumers switch to preferred alternatives. |
| Substitute | A product that can satisfy a similar want or need to another product. |
| Complement | A product consumed jointly with another product. |
| Supply | The quantity sellers are willing and able to sell at different prices over a period of time, other things equal. |
| Quantity supplied | The amount firms plan to sell at a particular price. |
| Supply schedule | A table showing quantities supplied at different prices. |
| Supply curve | A graph showing the relationship between price and quantity supplied. |
| Market supply | The total supply of all firms in a market. |
| Movement along a curve | A change in quantity demanded or supplied caused by a change in the product’s own price. |
| Extension of demand or supply | An increase in quantity demanded or supplied caused by a fall or rise in the product’s own price, respectively. |
| Contraction of demand or supply | A decrease in quantity demanded or supplied caused by a rise or fall in the product’s own price, respectively. |
| Shift of a curve | A change in demand or supply caused by a non-price determinant. |
| Increase in demand or supply | A rightward shift of the relevant curve. |
| Decrease in demand or supply | A leftward shift of the relevant curve. |
| Ceteris paribus | A Latin phrase meaning “other things remaining equal”. |
| Indirect tax | A tax placed on spending or production that can increase firms’ costs. |
| Subsidy | A payment or financial support that lowers firms’ effective costs or encourages production. |
| Consumer expenditure | The amount consumers spend, calculated as price multiplied by quantity purchased. |
| Revenue | The income received by firms from selling a product; price multiplied by quantity sold. |