I know quarto allows writing code and showing the output on the same page. I wanted to do it. So, first I wrote the code in a python file, checked it is working and then copied it here. and then I pushed it to be published. The run failed.
ah, that’s because the dependencies listed in the code were not available on the github repository. To fix the issue, one needs to specify dependencies in the quarto document so that they are installed when the document is rendered.
There are many ways of doing it.
specify dependencies in the page header.
    dependencies:
        - numpy
        - matplotlib
Add the dependendencies to the publish.yml document
- name: Install dependencies
      run: |
        pip install numpy
        pip install matplotlib
        # Add other dependencies here
Add dependecies to a text document like requirements.txt and then use this to install dependencies through publish.yml. This has the advantage that all you need to do is keep the requirements.txt updated and that will take care of the dependencies.
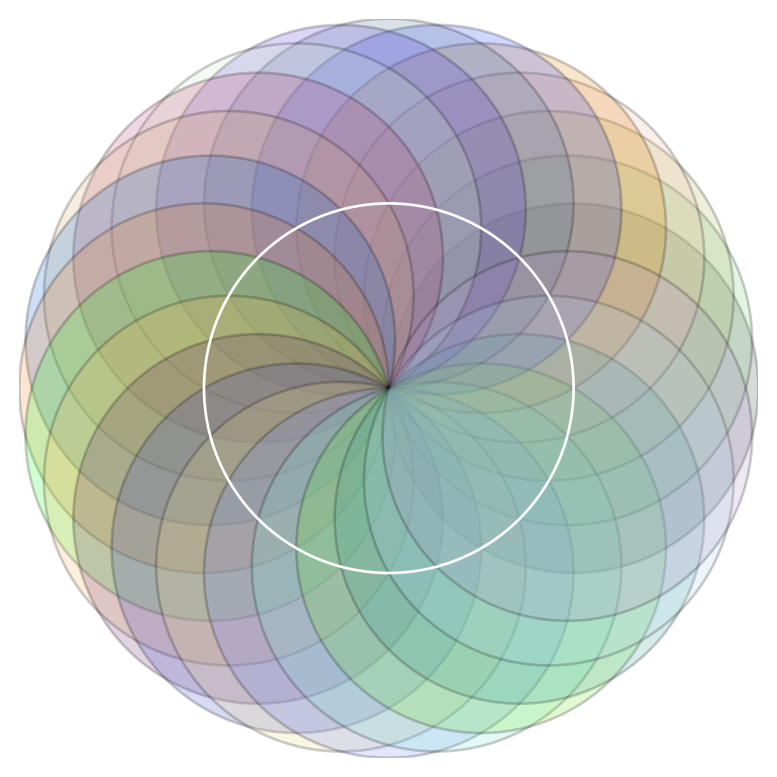
Now, the file gets published and the code runs. Example code below.
Code
import numpy as npimport matplotlib.pyplot as pltimport random# function generates random hex colordef random_hex_color():return"#{:06x}".format(random.randint(0, 0xFFFFFF))# sets up the subplotfigure, axes = plt.subplots()# define radius of the center circle, around whose circumference other circles are drawnr =10# Draw 24 circles with random colors, 2*np.pi angle is divided into 24 parts, each theta. the center of each circle is determined as r*cos theta and r*sin theta. at this center, circle is drawn with r as radius. for i inrange(24): theta = i * (2* np.pi /24) x1 = r * np.cos(theta) y1 = r * np.sin(theta) color = random_hex_color() draw_circle = plt.Circle((x1, y1), r, fill=True, edgecolor='black',facecolor=color,alpha=0.2) axes.add_artist(draw_circle) # this adds the circle to the plot. # draw the center circle, this is optional. draw_center_circle=plt.Circle((0,0),10, fill=False, edgecolor='white')axes.add_artist(draw_center_circle)# the plot area aspect ratio and limits are setupaxes.set_aspect(1)axes.set_xlim(-2*r, 2*r)axes.set_ylim(-2*r, 2*r)# Hide axes labelsaxes.set_xticks([])axes.set_yticks([])# Remove the borderfor spine in axes.spines.values(): spine.set_visible(False)plt.show() # this displays the plot. important.